
What's the cost of Brexit so far?
New analysis by the CER – which we will update quarterly – estimates that the UK economy is 2.1 per cent smaller as a result of the vote to leave the EU. The knock-on hit to the public finances is now £23 billion – or £250 million a week.
Any reasonable observer will acknowledge that the Brexit vote has curbed economic growth. While the economy outperformed expectations in the aftermath of the referendum, since then, the UK has dropped below Italy to become the slowest growing economy in the G7. In the first quarter of 2018, the economy only grew by 0.1 per cent. Despite an acceleration in the pace of global growth from the beginning of 2017, the UK economy has stagnated.
But how much has the decision to leave the EU cost the UK economy so far? The CER has conducted a simple modelling exercise to produce an estimate, which we will update quarterly from now on. According to this model, the British economy was 2.1 per cent smaller in the first quarter of 2018 than it would have been if the referendum had gone the other way.
According to CER’s new research, the British economy is now 2.1% smaller than it would have been if, two years ago, Britain had voted to stay in the EU.
How did we arrive at this figure? We have used the same method as a group of economists, led by Benjamin Born of the University of Bonn, who calculated the cost at 1.3 per cent of GDP in the third quarter of 2017. Essentially, we and Born’s group have used a computer program that allows researchers to create a ‘control’, despite the fact that we cannot conduct experiments on the UK economy. Scientists rely on control groups to see if a drug has an effect. One group is given the drug, and the other a placebo, and then scientists measure the difference between them. Obviously, this method is not available to us: we cannot make one Britain vote for Leave and one Britain vote for Remain and then measure the difference.
But we can construct a ‘synthetic UK’, which acts like a control group. To do this, we have taken quarterly real GDP, consumption and investment data for 36 OECD countries, starting in the first quarter of 1995. Out of that pool of countries, the computer program selects those whose economic growth most closely matches that of the UK between 1995 and the third quarter of 2016, when the referendum took place. The countries the program has selected are Canada (whose growth rate makes up 16 per cent of that of synthetic UK), Japan (20 per cent), Hungary (23 per cent) and the US (24 per cent), with a few other, mostly European countries, making up the remainder. This group of countries becomes the control, and the program continues to count how synthetic UK did after the referendum – and compare its performance to the real UK data. Chart 1 shows that synthetic UK closely matches the economic growth of Britain until the referendum vote, and then the two series diverge.

Chart 2 zooms in on the period after the referendum, from the third quarter of 2016. The impact of Brexit so far is the difference between synthetic UK’s growth and that of real UK. Thus our estimate is that the economy is now 2.1 per cent smaller than it would have been if Remain had won.
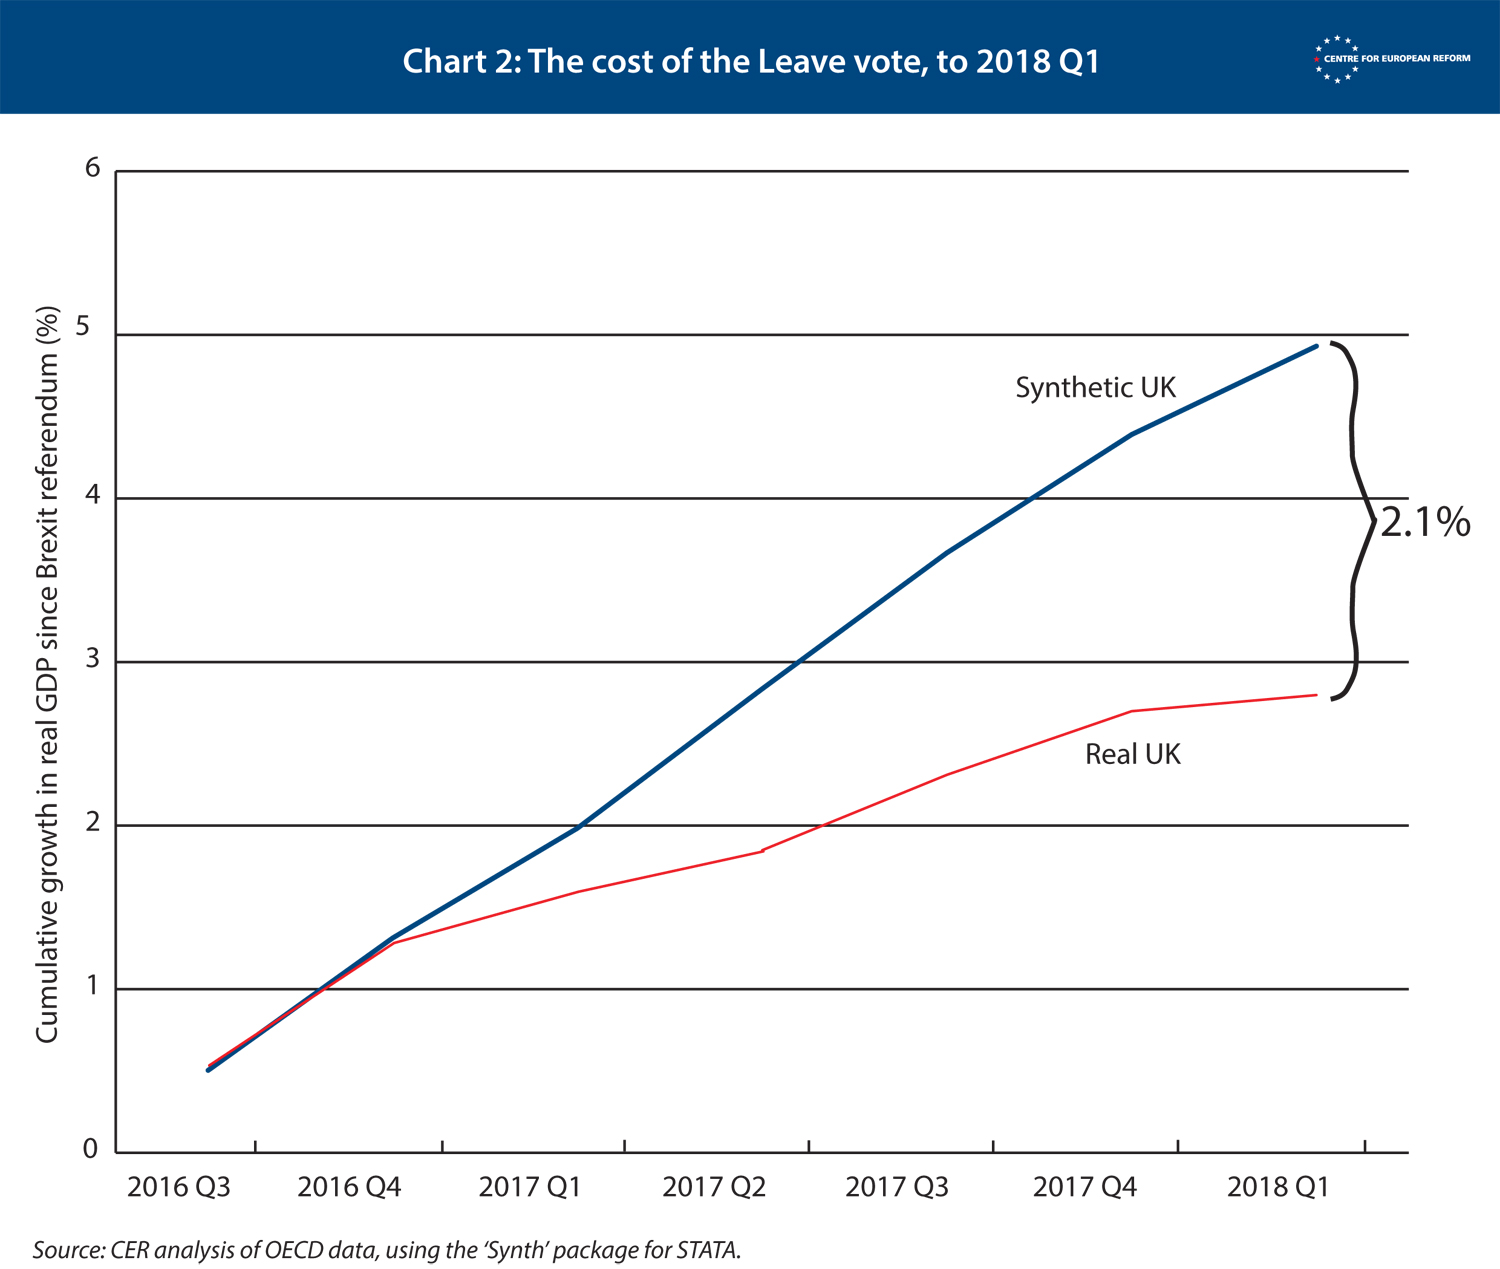
Some caveats are in order. First, this is an estimate. On average, our synthetic UK deviates from real UK by 0.5 percentage points in any given year (this is the so-called standard deviation). So, while it is almost certain that the real UK has performed worse than the synthetic one, 2.1 per cent is merely a central estimate with a margin of error around it.
Second, the control group matches the UK closely up to the referendum, but we cannot rule out a positive ‘shock’ to some of countries included – such as a surge in global demand for their exports – which the UK would not have enjoyed even if it had voted for Remain. That said, it is hard to say what growth the UK might have missed out on, given the broad-based global upswing in 2017. The countries that make up most of synthetic UK are all outside the eurozone, as is the UK. But Hungary, a poorer country, may raise some eyebrows. However, it has its own currency which has floated freely against the euro since 2008, and is closely integrated into the EU economy, like Britain.
Interested readers can see the source dataset here, the STATA script here and the results here.
What is the impact of that foregone growth on the UK’s public finances? At the time of writing, the government had just promised that the purported fiscal benefits of leaving the EU – the ‘Brexit dividend’ – would be used to fund a large increase in spending on the National Health Service. The foreign secretary, Boris Johnson, has been pressing for Vote Leave’s £350 million promise to be honoured. This has – rightly – outraged many people, since the government’s own fiscal watchdog, the Office for Budget Responsibility (OBR), has forecast that Brexit will raise the UK’s deficit and debt, thereby requiring tax rises, spending cuts or a combination of the two. The OBR, like most economists, think this because there is good evidence that the UK economy will be more closed to trade, investment and migration once it has left the EU, reducing tax revenues. There is also a £40 billion Brexit bill that must be paid to the EU in coming years.
There is no ‘Brexit dividend’. According to new CER analysis, Brexit is now damaging the public finances by £440 million a week.
Using our 2.1 per cent figure, it is possible to work out how much extra borrowing the UK’s foregone growth implies. The government’s own analysis of the cost of the various Brexit options, which was leaked in January, estimated how membership of the European Economic Area, a free trade agreement, or relying on World Trade Organisation rules to trade with the EU would hit the economy and public finances. This was based on a detailed analysis of taxes raised from different sectors of the economy, and how these Brexit options would damage them. The analysis found that 1 per cent of lost GDP growth resulted in £11 billion of extra borrowing. Since we have found that the cost so far is 2.1 per cent, that adds up to £23 billion additional borrowing so far. Our estimate shows there is no Brexit dividend. The Leave vote is now costing the Treasury £250 million a week.
In the future, it may come to pass that ‘Project Fear’ did indeed exaggerate the cost of Brexit, and whichever relationship the UK manages to negotiate is better than the economists’ consensus. We will update our model as the quarterly GDP data comes in – and as a result, we will have a decent basis to test the claims made by Leave and Remain. So far, our analysis shows the Remain campaign – and the vast majority of professional economists – have been closer to the truth.
John Springford is deputy director of the Centre for European Reform.
Comments
Add new comment