
The cost of Brexit: May 2021
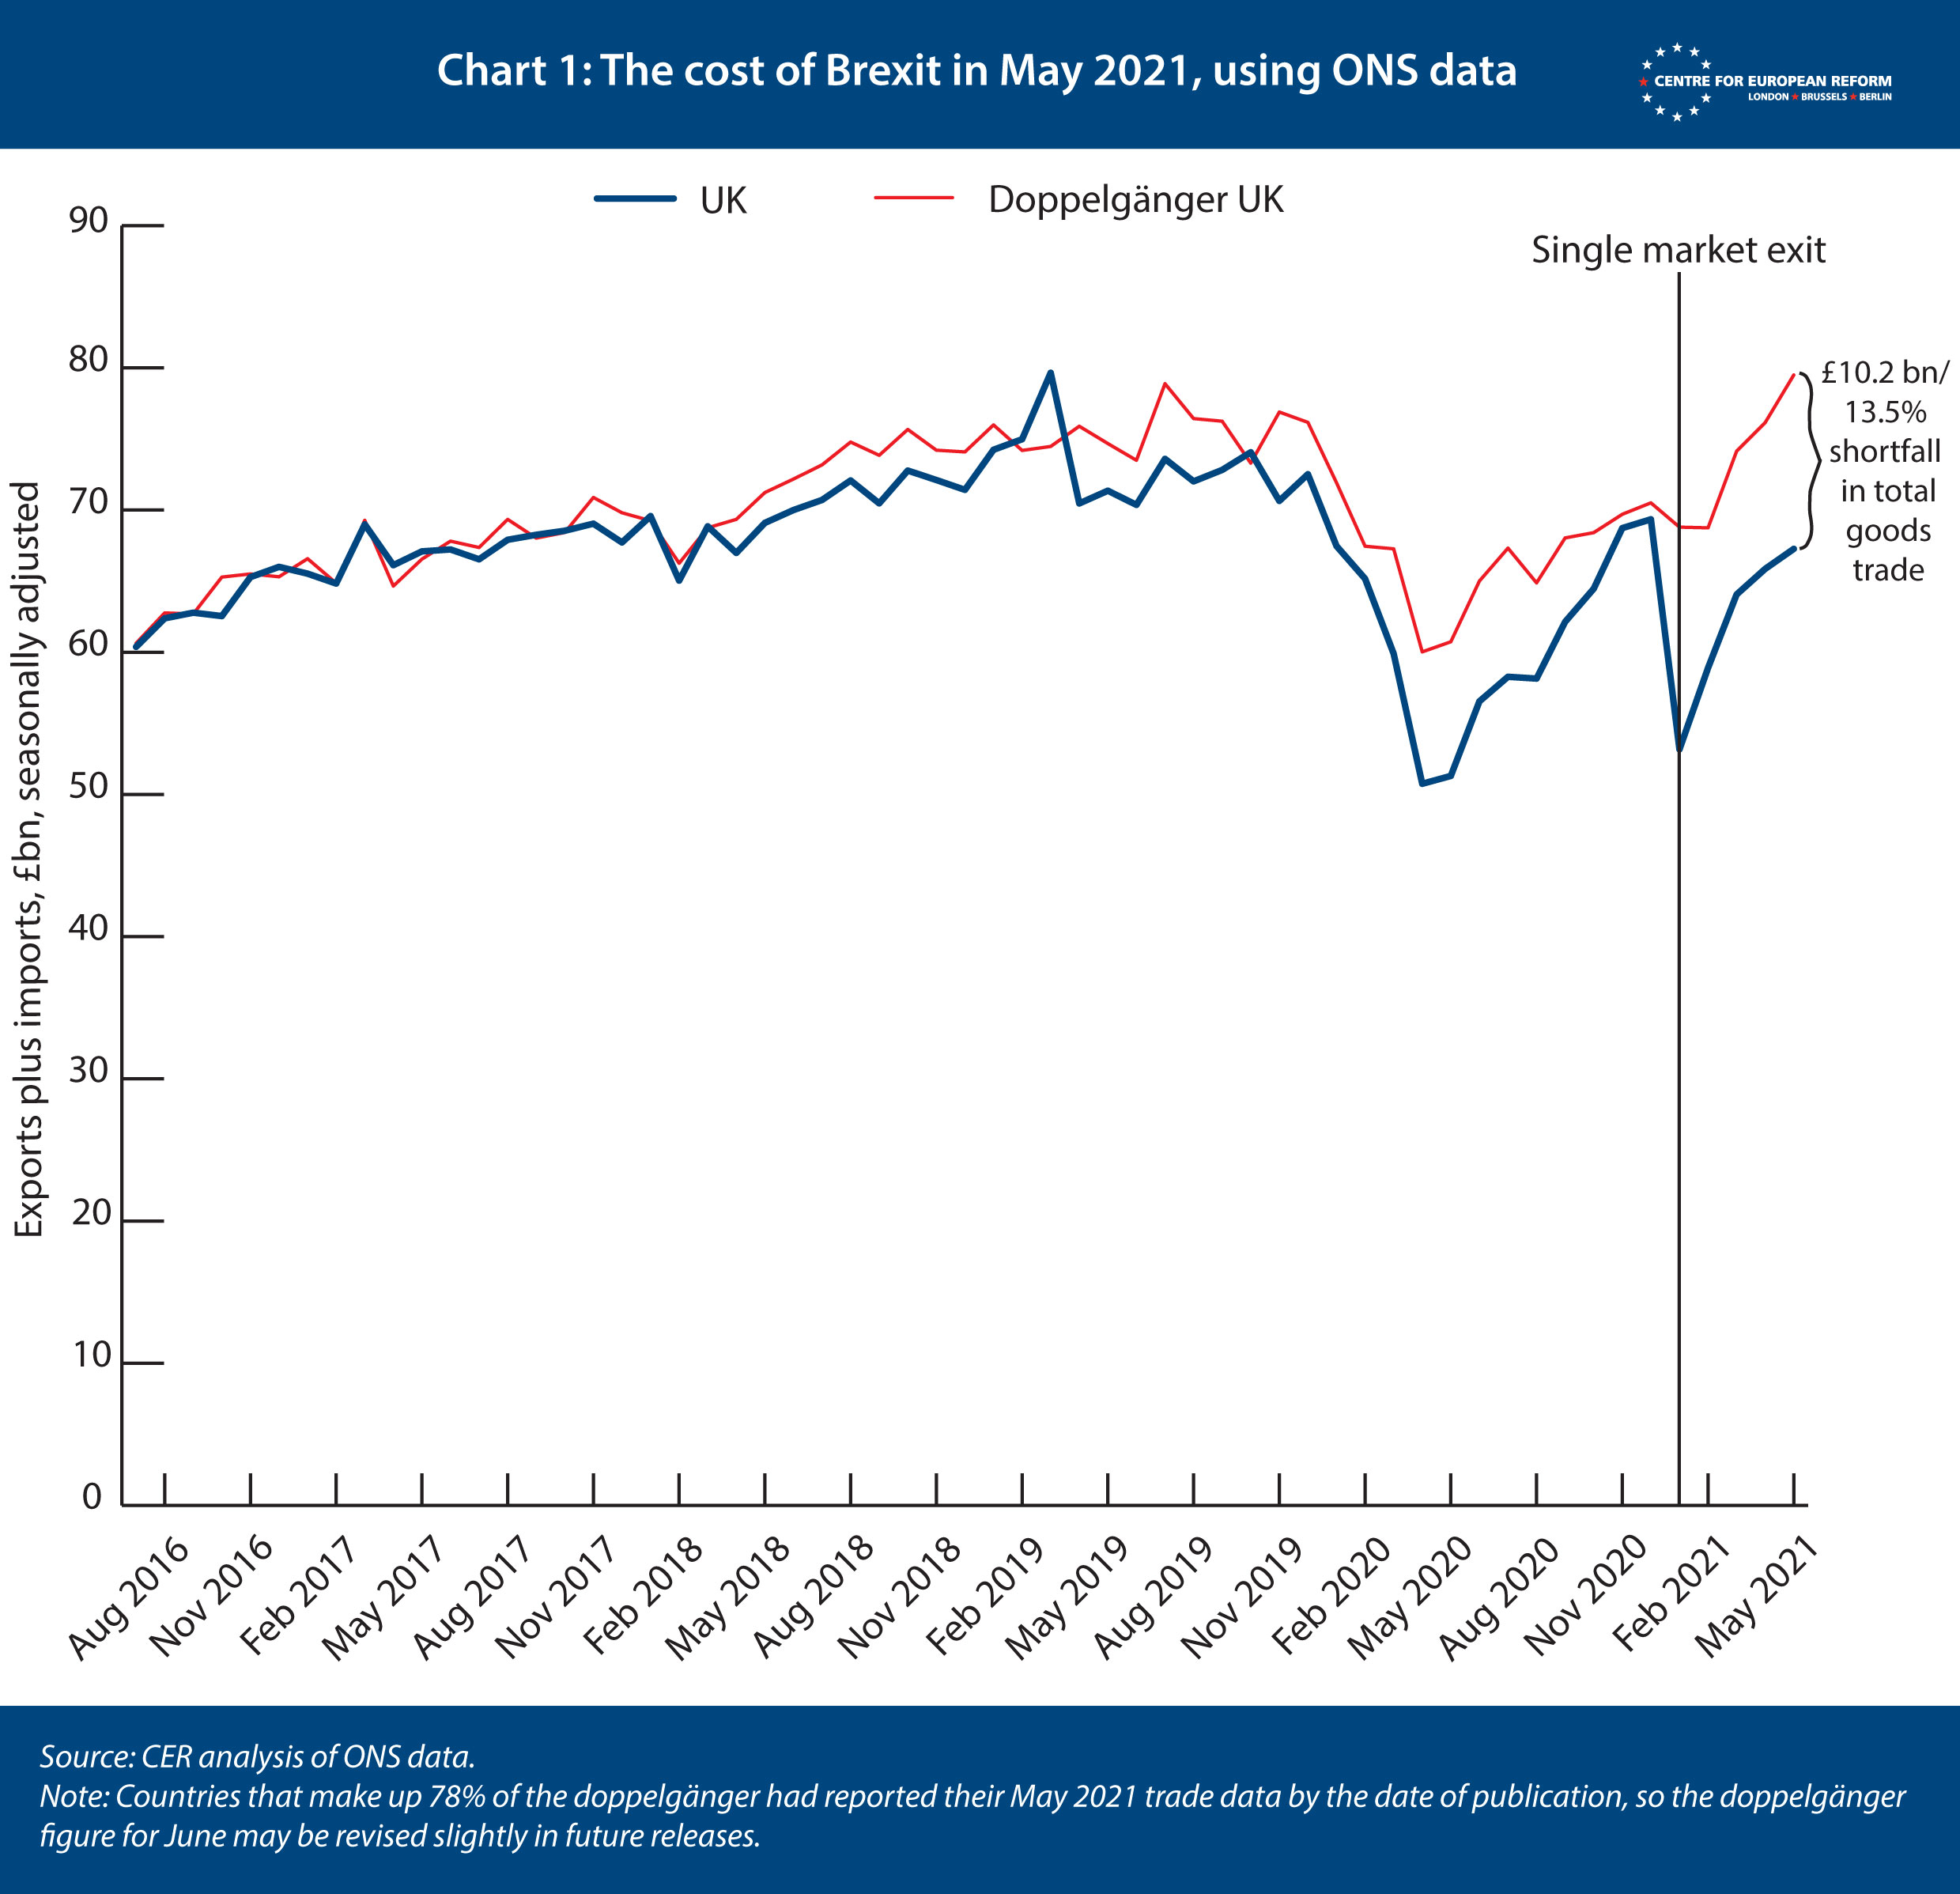
The Centre for European Reform estimates that leaving the single market and customs union has reduced UK trade in goods by £10 billion or 13.5 per cent in May 2021.
Discrepancies between the statistics produced by Eurostat and the UK’s Office of National Statistics (ONS) do not quicken everyone’s pulse, but the difference between the two agencies’ measures of UK-EU goods trade is important. According to Eurostat data, the hit to EU-destined UK exports since it left the single market in January has been far larger than the ONS measures – and larger than the reduced trade that were fed into the UK government’s model, which forecast a 5 per cent hit to GDP per capita from Brexit. If Eurostat is right, Britain might be facing greater Brexit costs than we had anticipated. This new piece in the series on the cost of Brexit will take a closer look at whether the differences in trade data between ONS and Eurostat are creating biases in our estimates. There are good reasons to believe that the ONS is closer to the truth.
Before getting into that problem, however, let’s provide the latest estimate from our cost of Brexit model. Using the ONS’s May 2021 data, the model finds that leaving the single market and customs union has reduced total UK goods trade by £10 billion, or 13.5 per cent (see Chart 1). That is up from the previous month, when the gap was 11 per cent. On average, Britain’s imports grew more slowly than the other advanced economies that make up the ‘doppelgänger’ UK between April and May, which explains most of the difference. However, we should not leap to conclusions about one month’s change in either direction, because monthly trade data are volatile.
To construct the doppelgänger, an algorithm selects a subset of countries from 22 advanced economies whose trade performance and other economic characteristics closely match those of the UK between 2009 and 2019, before the pandemic struck and sent economic data haywire. These countries did not leave the single market and customs union in January, so they offer a counterfactual path for UK goods trade if the UK had stayed in. More details on how the model works are available here.
As for the differences between Eurostat and ONS data, Chart 2 sets out the problem. According to Eurostat, in May this year British exports to the EU were 19 per cent lower than they were two years earlier (by comparing to May 2019 we remove the effects of the first European lockdown in 2020). But ONS says that exports are only down by 4 per cent. And it’s not just a problem on the export side: Eurostat says UK imports from the EU were 11 per cent lower this May than in May 2019, while the ONS says they were down 17 per cent.

The difference between doppelgängers constructed using ONS and Eurostat data is not large. Using the same model but with Eurostat goods trade data, the difference between the UK and the doppelgänger is £9.4 billion (see Chart 3), compared to £10.2 billion using the ONS data.

Eurostat only provides data on third countries’ goods trade with the EU-27, not with the globe, whereas our ONS-based model uses UK and advanced economy trade with the world. As a result, in percentage terms the ONS shortfall is 13.5 per cent and that of Eurostat, 23 per cent. That’s because UK goods trade with the EU is a little less than half of its total trade.
In order to decide which model is better to use, we need to know why these differences exist. In a blog post, ONS statistician Matt Hughes argued that Eurostat’s data on UK exports to the EU were the problem. That is because, up to the point of leaving the single market in January 2021, Eurostat included the UK’s re-exports from third countries as UK exports to the EU. A widget that arrived from China and was sold on to the EU would be counted as a UK export, regardless of whether value was added in the UK. From January, Eurostat moved the UK onto their standard procedure for countries outside the EU, counting re-exports on a ‘country of origin’ basis. This meant that, say, Japanese car parts that were re-exported to the EU from the UK would be counted as Japanese exports to the EU in January 2021, but UK exports in December 2020. As a result of this change, Hughes argues that Eurostat overstates the fall in UK-EU goods trade, because the data was calculated in an inconsistent way before and after January 1st 2021.
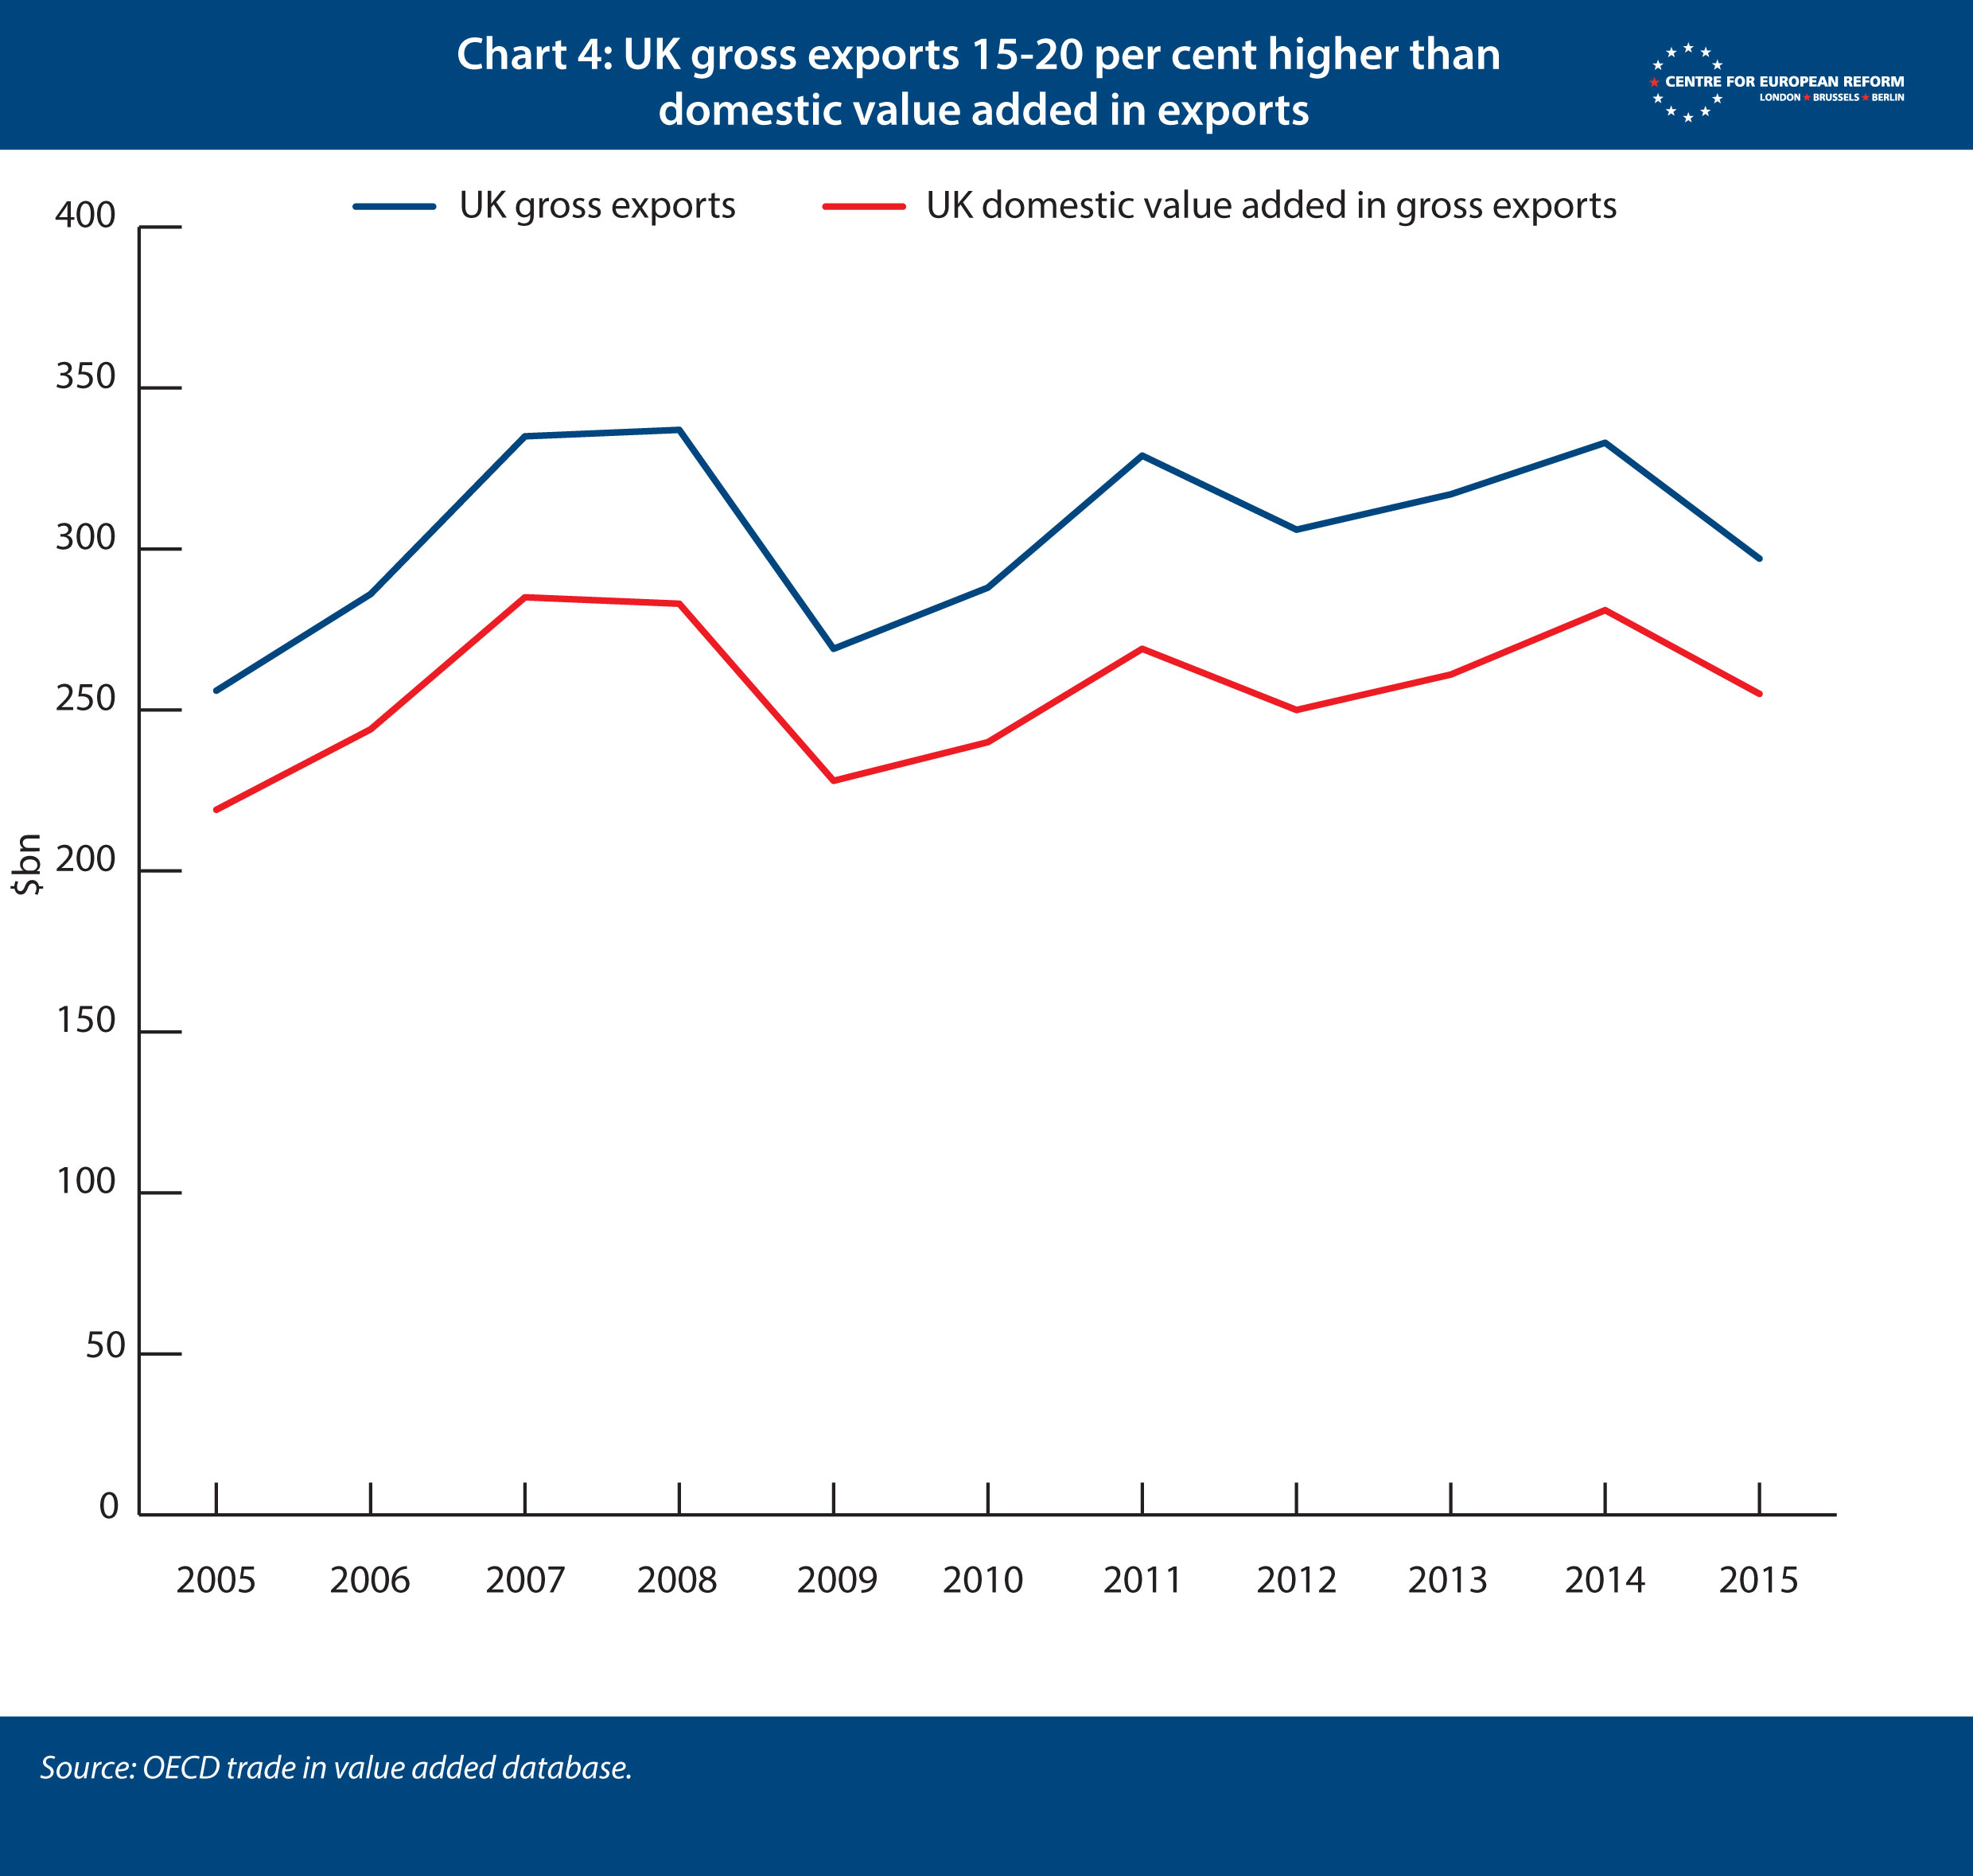
In support of Hughes’s argument is the difference between the UK’s gross exports and the value added that UK workers put into those exports. According to OECD data – unfortunately, only available up to 2015 – UK gross exports are somewhere between 15 and 20 per cent higher than domestic value added (Chart 4). In May 2021, the gap between Eurostat and ONS measures of UK exports to the EU was 15 per cent. The OECD measure seems to fit with Eurostat including re-exports – exports that have little or no value added to them by UK workers – in their post-January data. As Thomas Sampson of the London School of Economics pointed out in a recent tweet, Eurostat can – and should – confirm whether the switch to country of origin has exaggerated the impact of Brexit, as it has access to UK exports data that is on the same basis as the ONS.
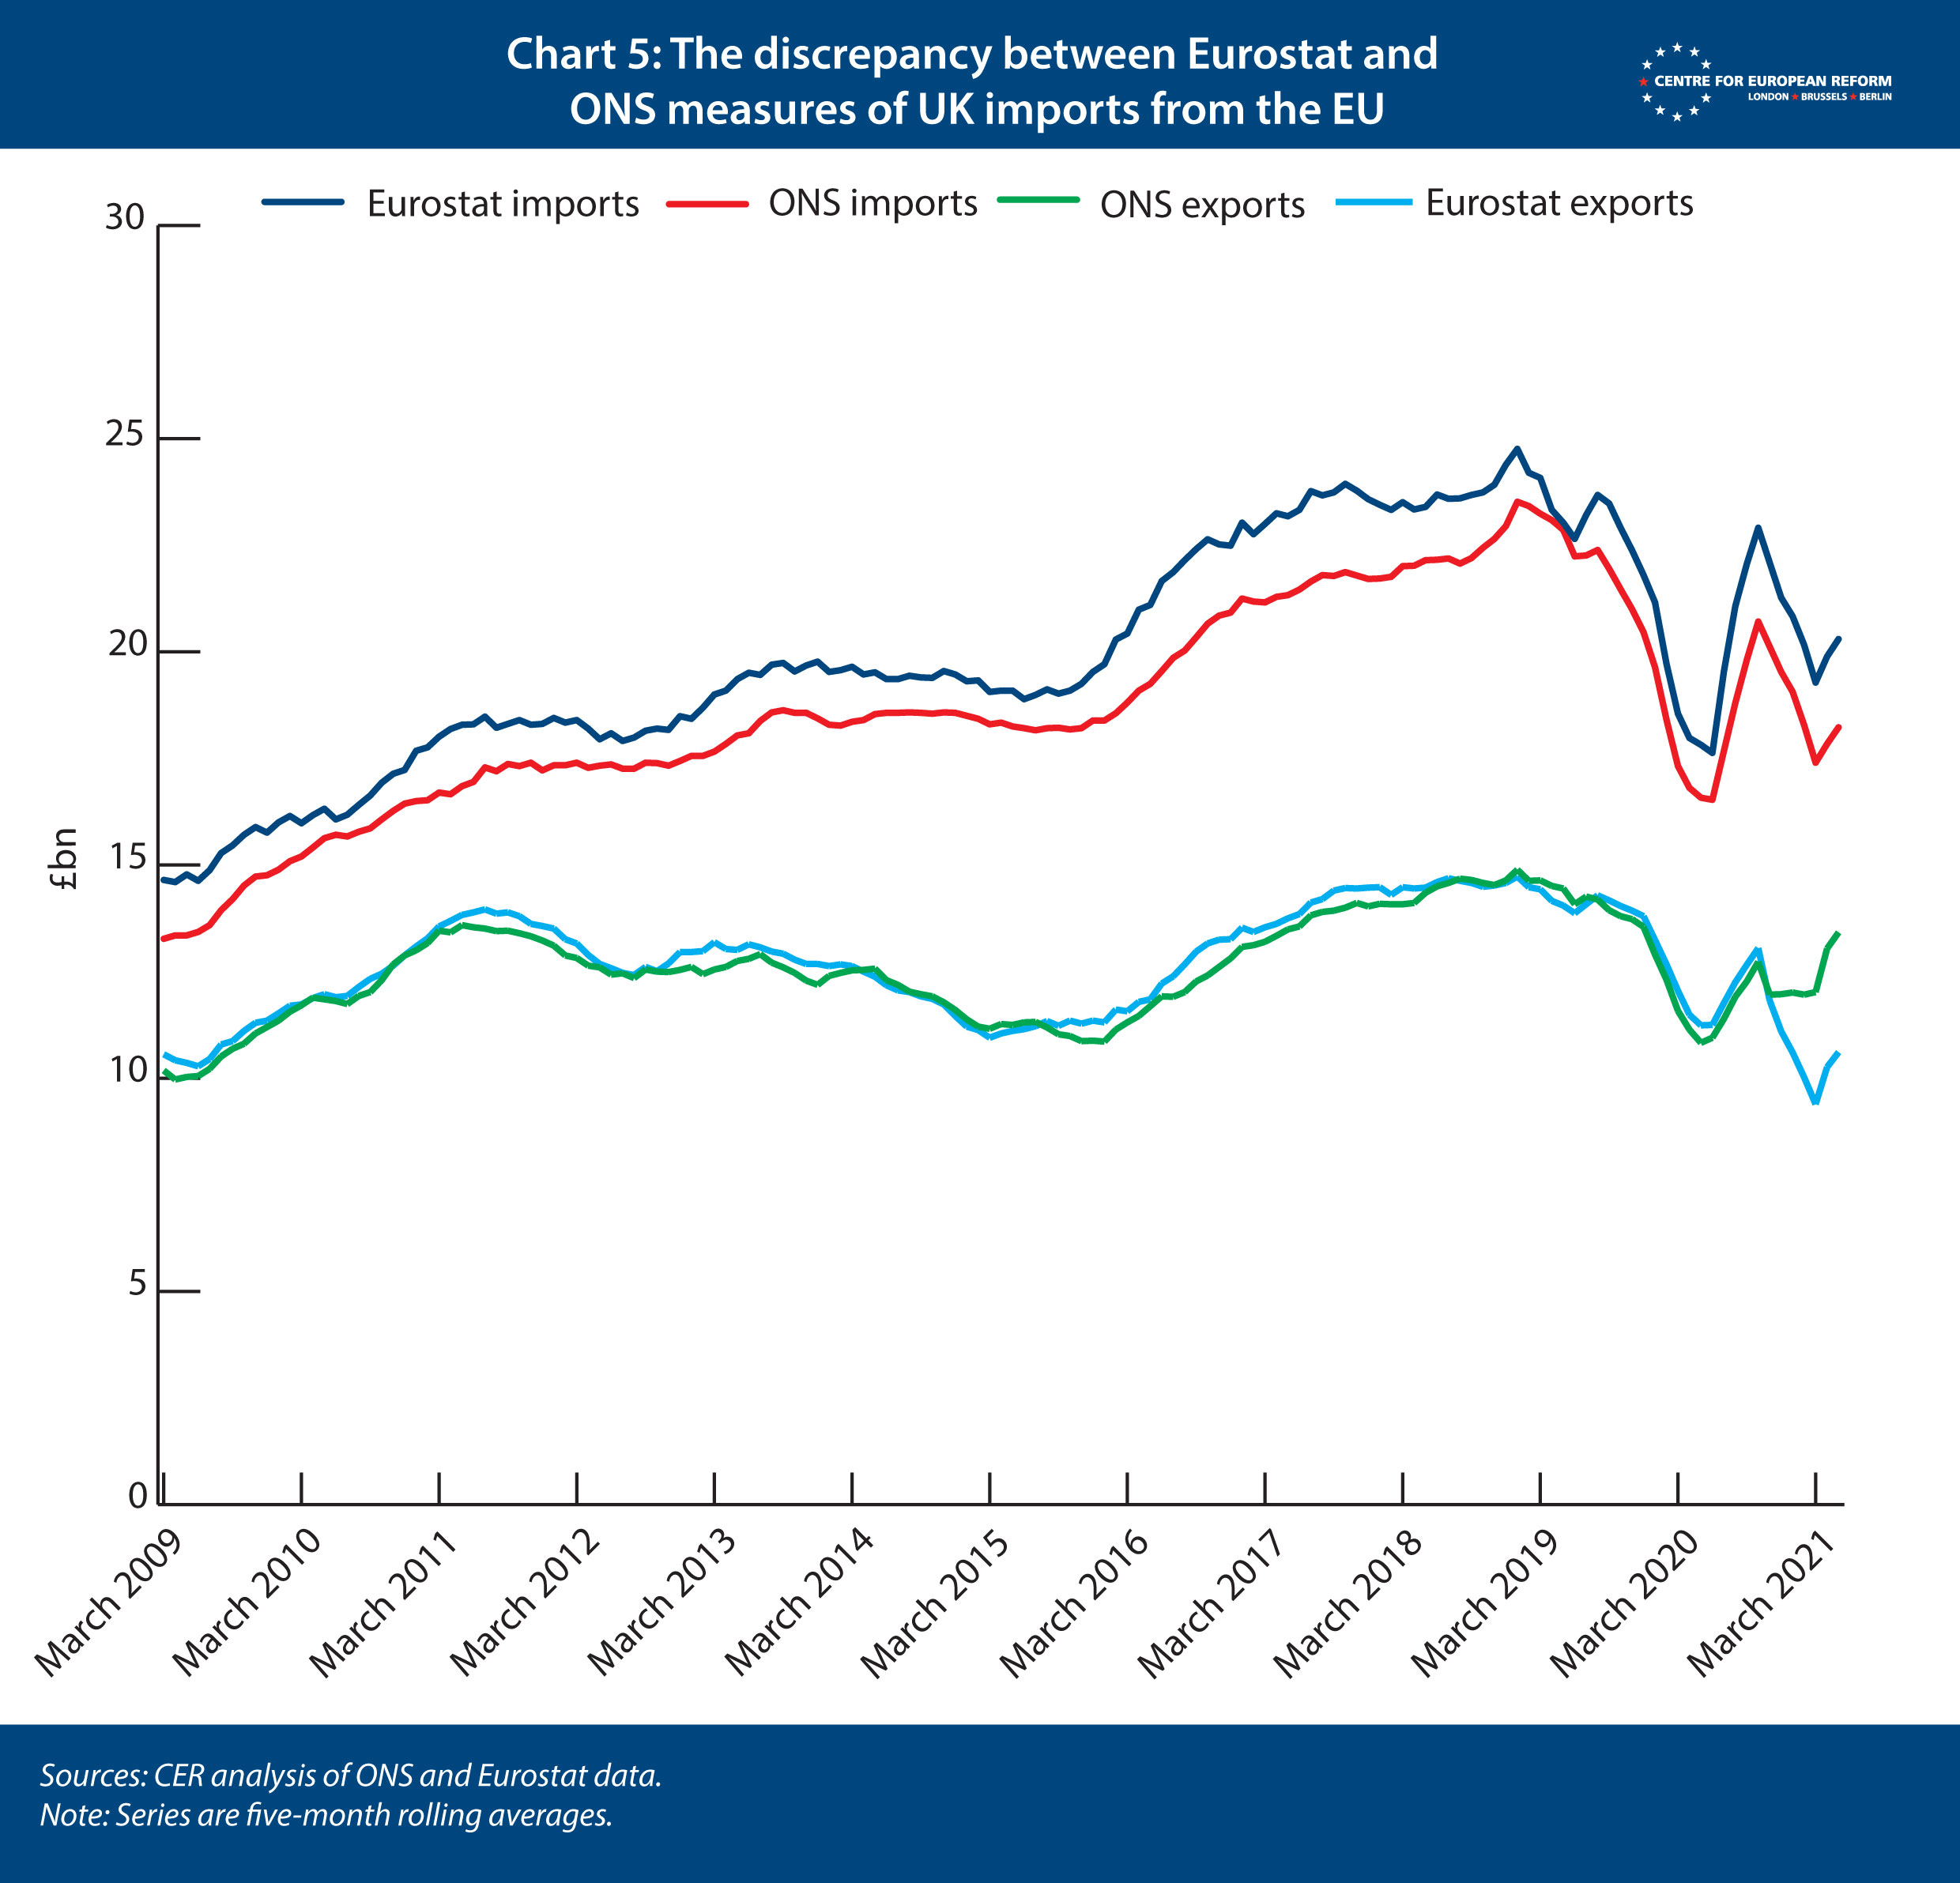
But what about Eurostat’s higher estimate for UK imports from the EU? This is a longstanding issue, which precedes Brexit, as shown by Chart 5. Unlike exports, there isn’t a big difference before and after the end of the transition period: Britain is continuing to use the EU’s Intrastat survey for imports rather than customs forms, because the government decided not to impose most import controls until January 2022. The reason for this difference is that the ONS adjusts the Intrastat survey to convert it to a ‘balance of payments’ measure, whereby trade is only counted if it entails a change of ownership. That has the effect of stripping out goods that move between branches of the same company in different countries. Ideally, a doppelgänger method should include these goods, because we would expect Brexit to reduce the supply chains within companies that have operations in both the UK and EU member-states. However, these transfers do not result in changes to UK national income. And we have not seen the Eurostat measure of imports converge on the ONS’s since January 2021, which suggests that, since the UK left the single market, intra-company transfers of goods have not fallen further than sales between companies.
The upshot is that we will continue to use ONS data for the cost of Brexit series, because its measure of exports is more reliable and, so far at least, ONS’s balance of payments measure of imports does not appear to be understating the extent to which intra-company supplies are being disrupted by Brexit.
John Springford is deputy director of the Centre for European Reform.
Related content

The cost of Brexit: April 2021

The cost of Brexit: March 2021

The cost of Brexit: February 2021

Add new comment