
The cost of Brexit to June 2022
My latest update estimates Brexit reduced Britain's GDP by 5.5 per cent by the second quarter of 2022. My model avoids the cherry-picking of data, and performs better than its critics’ methods.
Since 2018, the CER has published estimates of the impact of Brexit on the UK’s economy. In this insight, I update these estimates with data until June 2022, and discuss the critique of my model published by Graham Gudgin, Julian Jessop and Harry Western on the ‘Briefings for Brexit’ website.
These estimates are based on the ‘doppelgänger’ method, in which an algorithm selects countries whose economic performance closely matches the UK’s before Brexit. The method provides a counterfactual UK that did not leave the EU. Chart 1 shows quarterly estimates of the cost of Brexit to the second quarter of 2022. UK GDP is 5.5 per cent lower than that of the doppelgänger. Investment is 11 per cent lower; goods trade, 7 per cent lower; and services trade is around the same.
The Brexit hit has inevitably led to tax rises, because a slower-growing economy requires higher taxation to fund public services and benefits. If Brexit had not happened, most of the tax rises that then Chancellor Rishi Sunak announced in March 2022 would not have been necessary. If the UK economy had grown in line with the doppelgänger, tax revenues would have been around £40 billion higher on an annual basis (if we apply the same tax-to-GDP ratio as in 2021-2 – 34 per cent). In his March 2022 budget, Sunak announced tax rises of £46 billion.
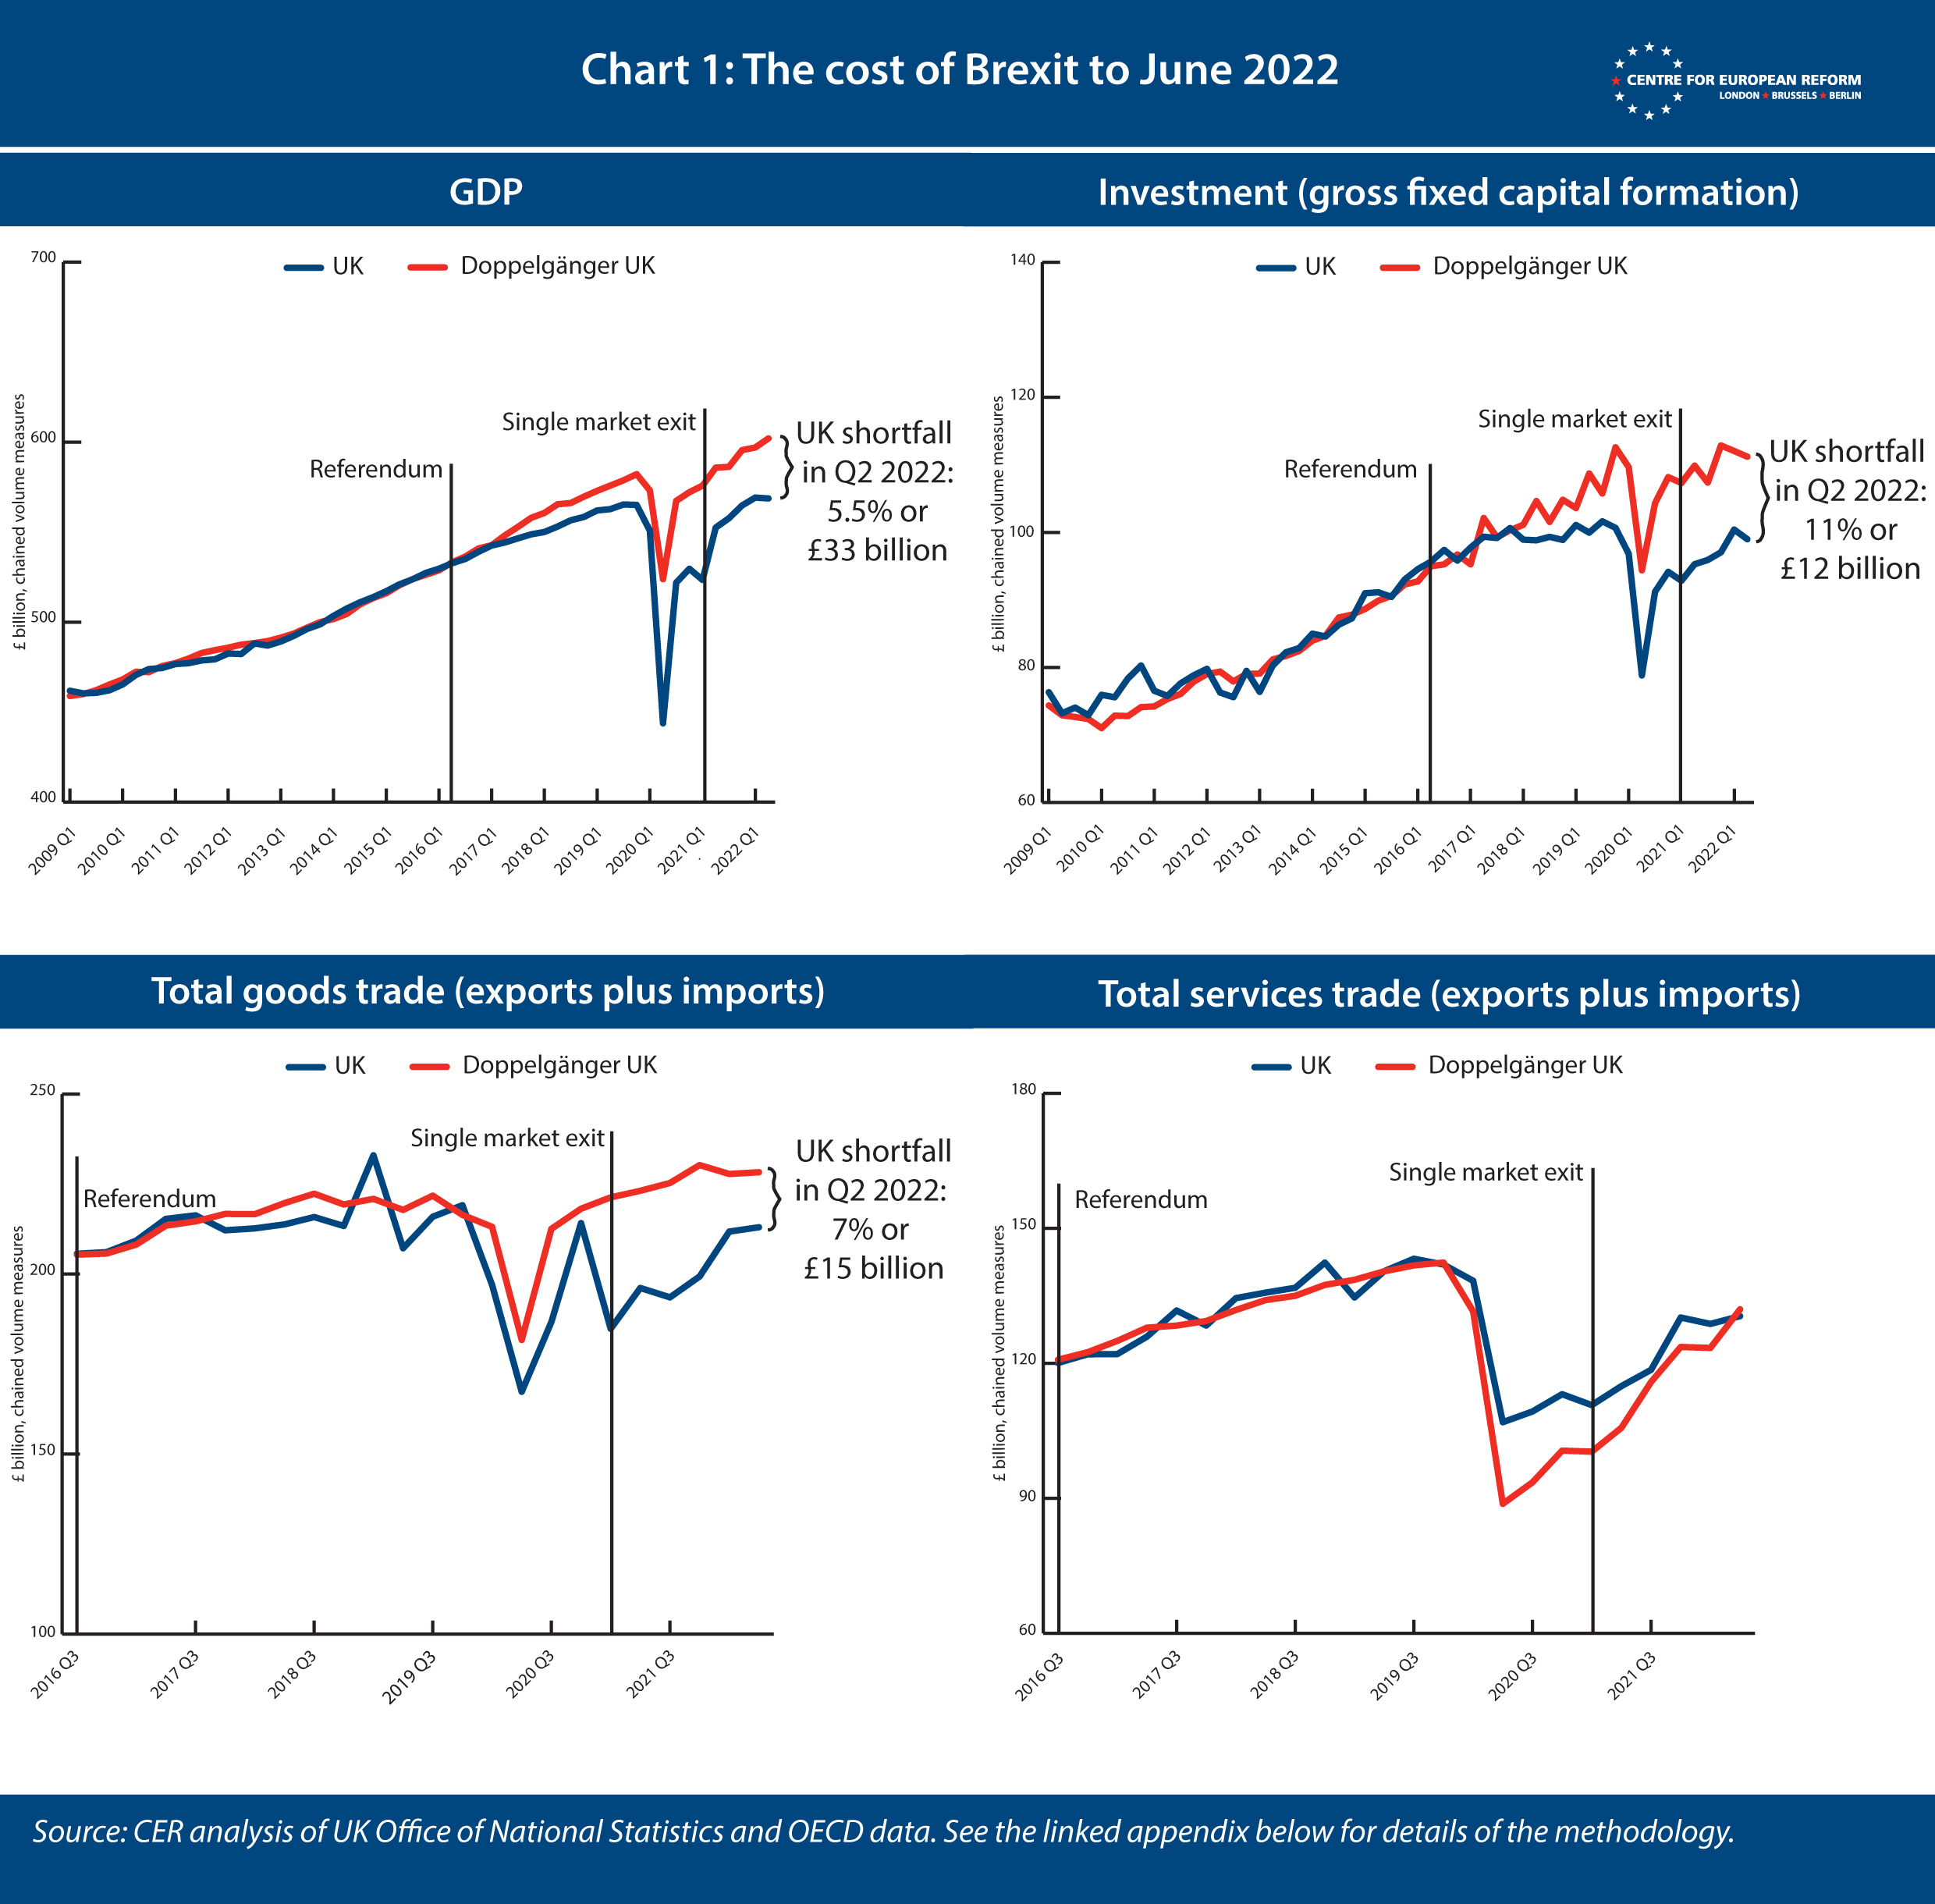
The shortfalls in GDP and investment are around the same as the last estimates, for the fourth quarter of 2021. This suggests that the impact of Covid-19 is not substantively affecting the results, a concern I raised last time. All of the 22 countries used in the study had almost entirely reopened by June 2022, and yet Britain continued to lag behind the doppelgänger. And, as measured by excess deaths through the pandemic, Britain ranked in mid-table globally – so there’s little reason to believe the long-term scars on the economy are larger than in other countries, on average.
The goods trade shortfall has narrowed from 13.6 per cent last time, but goods trade is volatile, so it is too soon to tell whether UK goods traders have started to shrug off trade barriers. The UK’s services trade lead over the doppelgänger has nearly vanished. This is probably because the UK receives fewer tourists than the countries that make up the services doppelgänger: with tourism – a tradable service – getting back to normal over the past summer, the doppelgänger caught up.
Brexit had reduced GDP by 5.5%, investment by 11%, and goods trade by 7% in the second quarter of 2022.
For a detailed explanation on the method used to make these estimates, please read the appendix of the last update. Here is a brief summary. An algorithm compares data on the UK’s economic performance with that of 22 other advanced economies. It selects a subset of those countries and allocates each a weighting, to create a basket of countries that form a doppelgänger UK. Countries are chosen to minimise the difference between the doppelgänger’s data and that of the UK. The algorithm matches the quarterly growth rate of real GDP, GDP per capita and inflation, investment (gross fixed capital formation), trade and industrial production as a share of GDP, and average years of schooling of the adult population. Thus we have a counterfactual UK that did not leave the EU; and we can then compare the performance of this doppelgänger against that of the UK and gauge Brexit’s impact on GDP, investment, and goods and services trade.
As ever, I am making the input data for the models and the STATA code available.
A response to critics of the model
Graham Gudgin of Policy Exchange, Julian Jessop of the Institute of Economic Affairs, and ‘Harry Western’, the pen name of a researcher who would prefer to remain anonymous, have written a lengthy rebuttal of the growing literature on the negative impact of Brexit on the British economy. Since a fair amount of their paper criticises the doppelgänger method, a rebuttal of their rebuttal follows.
They make two main criticisms.
First, they argue that the model too narrowly relies on a period of catch-up growth after the global financial crisis. I use data between the first quarter of 2009 and the referendum in the second quarter of 2016 to identify the countries that make up the doppelgänger. They claim this “serious flaw” means that the model “will naturally select faster growing economies” and, as a consequence, “most eurozone countries except Germany are thus excluded”. And they claim that period of fast growth would have come to an end around 2016, and therefore, “to ascribe any slower growth after 2016 Q2 to Brexit is heroic to say the least”.
Second, the authors say that “the choice of comparison countries for the UK in these models is often inappropriate”, because “they (…) are economically very different from the UK”. Instead, they contend that we should compare the UK to France, Germany and Italy, because they are similar-sized economies and in Europe. After comparing the UK to those countries, they assert that “there is no evidence that UK growth has underperformed since either the Brexit referendum or the period outside the EU’s single market and customs union since January 2021”.
These two concerns can be dispelled by examining Chart 2. The chart shows UK growth rates compared to various countries and country groups – and the doppelgänger – in three periods: between the introduction of the euro in 1999 and the end of 2008, between 2009 and the referendum in 2016, and between the referendum and the second quarter of 2022.
The chart shows that the 2009-16 period was not a period of catch-up growth for almost any advanced economy, except, perhaps, Germany, and that the UK was unusual in seeing its growth rate fall after the referendum. Growth rates were higher after 2016, on average, across the 22 most advanced economies that I use in this estimate, a little higher in France, and significantly higher in Italy. The US grew at a similar rate after 2016 as it did before. The G7’s growth rate was dragged down by Germany, whose growth rate more than halved after 2016, probably because of stalling export growth – Germany is particularly exposed to the US-China trade wars.
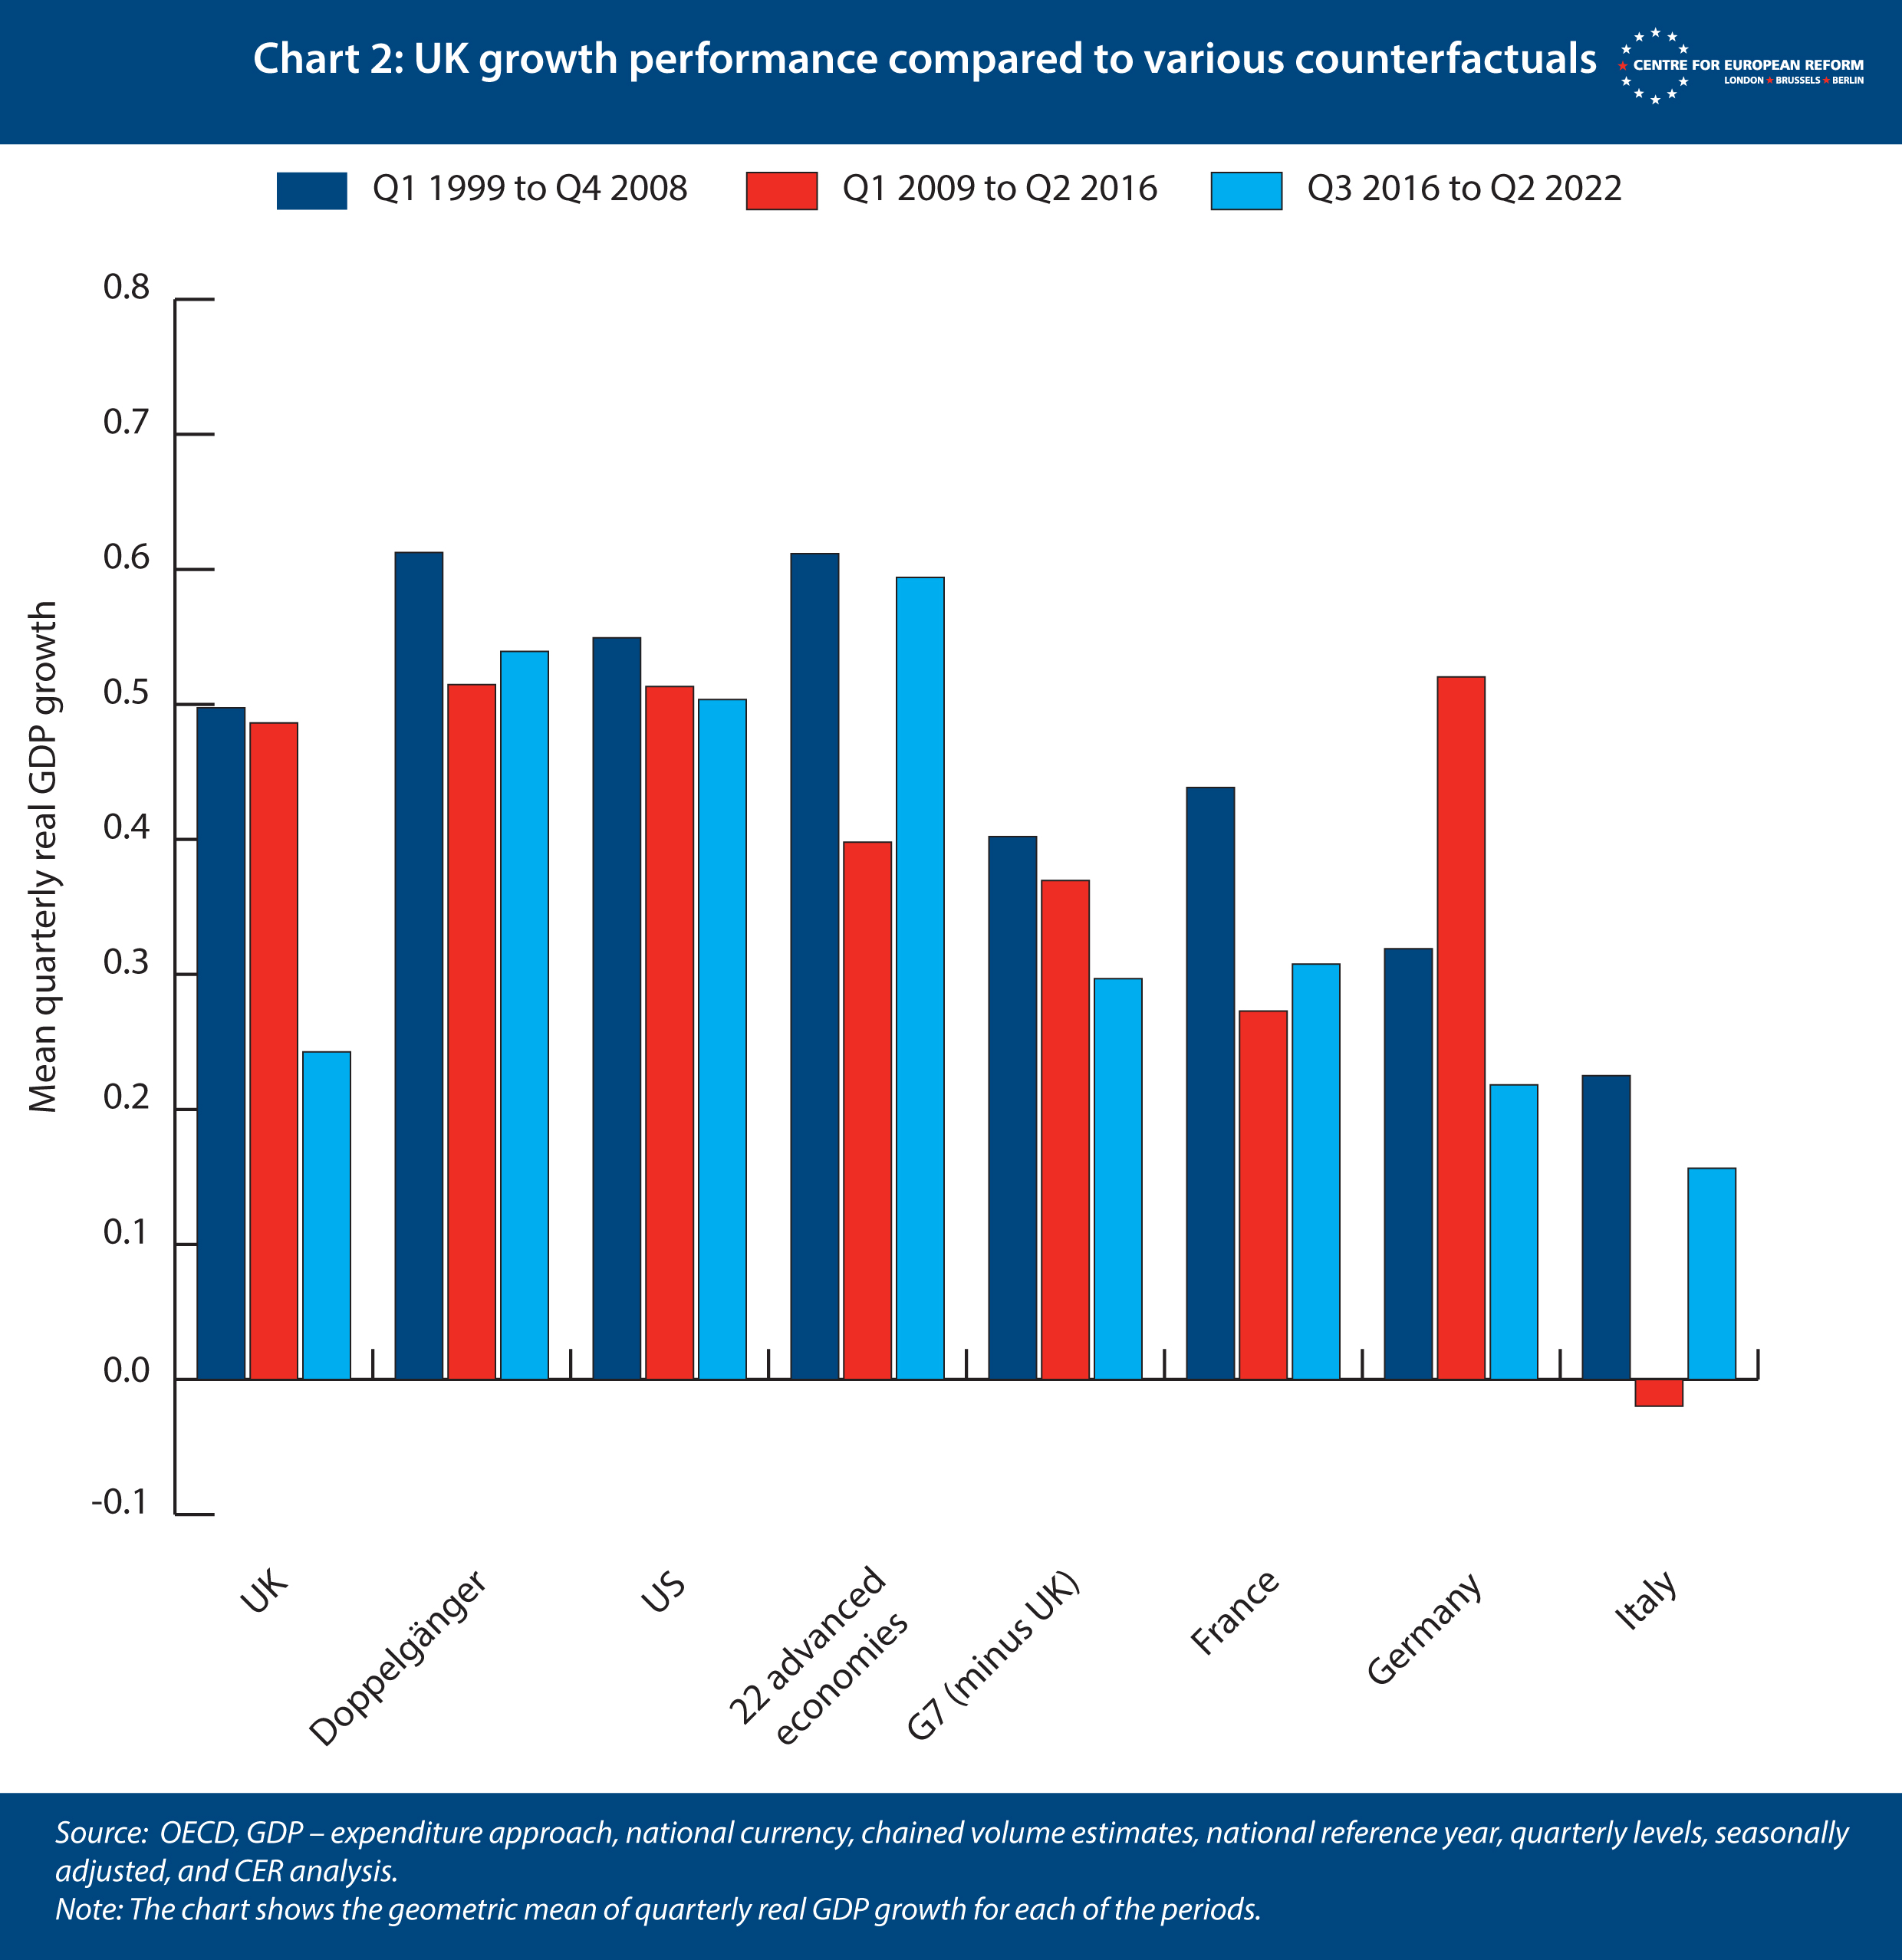
The argument that Germany, France and Italy are better counterfactuals than the doppelgänger is also wrong. Gudgin, Jessop and Western assume that bigger European economies are more suitable because the UK is a bigger European economy. But just because countries are of a similar size in a similar region, they do not necessarily have a similar economic model or growth rates. Better doppelgänger countries may be found elsewhere by the algorithm. Indeed, the UK’s growth rate between the introduction of the euro in 1999 and 2016 was markedly different to France, Germany and Italy’s. It was far closer to that of the US.
Those who claim Brexit has had no discernible impact on GDP should explain why the UK’s growth rate fell so markedly after the referendum.
Most important, the doppelgänger grew a little faster than the UK before 2009, but not markedly so. This is unsurprising, when recalling how the method works: the algorithm is asked to identify those countries whose economic growth, shares of investment, industry and trade in GDP, inflation rates, years of schooling of the adult population, and per capita growth most closely match those of the UK. The method seeks to find countries whose economies are most similar to the UK’s – rather than using rules of thumb like country size or geographical proximity. The euro, larger public sectors, larger manufacturing sectors, and faster population ageing mean that there’s no good reason why Britain being in Europe should compel us to use France, Germany and Italy as Brexit counterfactuals.
That is why the algorithm tends to choose Anglosphere countries, such as the US, Australia and New Zealand, to balance European countries like Germany. And if we use the same country shares that the algorithm selects for the 2009-16 period, and see how much the doppelgänger grew between 1999 and 2008, we see that it is similar to the UK.
Finally, there are a few analysts who think my estimate is based upon legitimate methods but is on the high end of estimates for the cost of Brexit. This is perfectly reasonable – counterfactuals are notoriously difficult, because they are based on “branching histories”, as Boris Johnson’s former advisor Dominic Cummings put it. (If only we could visit the universe in which Brexit did not happen.) Jonathan Portes, Professor of Economics at King’s College London, says that a plausible range for the cost of Brexit is between 1 and 5 per cent of GDP, with my estimate at the top of the range. For its part, the Office of Budget Responsibility (OBR), the British government’s fiscal watchdog, assumes that, over 15 years from 2016, Brexit will reduce GDP per capita by 4 per cent. That number is based on a range of forecasts made by reputable institutions. The OBR also thinks that by the time the Trade and Co-operation Agreement (TCA) came into force in January 2021, the cost of Brexit was 1.6 per cent, thanks to uncertainty and depressed investment.
The analysis above poses a challenge to this view. If the cost of Brexit is a lot smaller than my estimate, why did the UK’s average quarterly growth rate fall so much more than other advanced economies after the referendum – especially those whose economic performance was similar to the UK’s before 2016? Researchers at the London School of Economics (LSE) put together a forecast with trade barriers reducing productivity growth, in which the long-run cost of Brexit is larger than 4 per cent. A 5 per cent hit is within the range of plausible forecasts.
It is also plausible that the costs of Brexit are more frontloaded than the OBR assumes. Conditional forecasting models do not try to estimate the speed of the economy’s adjustment to trade barriers, but assume that it will take ten to fifteen years to move from one equilibrium to another. However, trade barriers were immediately erected in 2021, and free movement immediately ended, so the negative impact on the UK economy was also immediate, on top of the effects of sterling’s decline and stagnant investment after 2016. And that stagnant investment must have reduced productivity growth between 2016 and now – an effect that the LSE researchers tried to account for in their forecast that produced bigger Brexit costs.
Overall, we should not assume that similar-sized European countries are the best counterfactual for Brexit Britain. The ‘doppelgänger’ method avoids any cherry-picking of comparator countries, by using a statistical process to find economies that best match the UK’s. Nor should we assume that Brexit costs are small at present, simply because the assumptions behind long-run forecasts imply that the costs should be small shortly after the introduction of the TCA. And it is possible the long-run costs of Brexit might be larger than the OBR estimate, despite that institution’s authoritative position in the economic policy debate.
John Springford is deputy director of the Centre for European Reform.

Comments
If this has not been done, I was wondering if one way forward could be to assess the accuracy of the used doppelganger method by applying the identical analysis used above for the UK to a basket of other countries. If you fit the model to data from Q1 2009 to Q2 2016 to a selection of other countries and then extrapolate then this may a) provide evidence for the accuracy of the metholodgy and b) allow you to make an estimate of the uncertainty on the headline figure.
My apologise if this has already been done but I've missed this analysis in your work? Otherwise- its an interesteing read- thanks.
Add new comment